Applications

Built for teams that need evidence, not just imagery

From farm fields to district emissions, BluVerify gives each question a dated, measured answer. Every image on this page is real BluVerify output for sites in Gujarat, India.

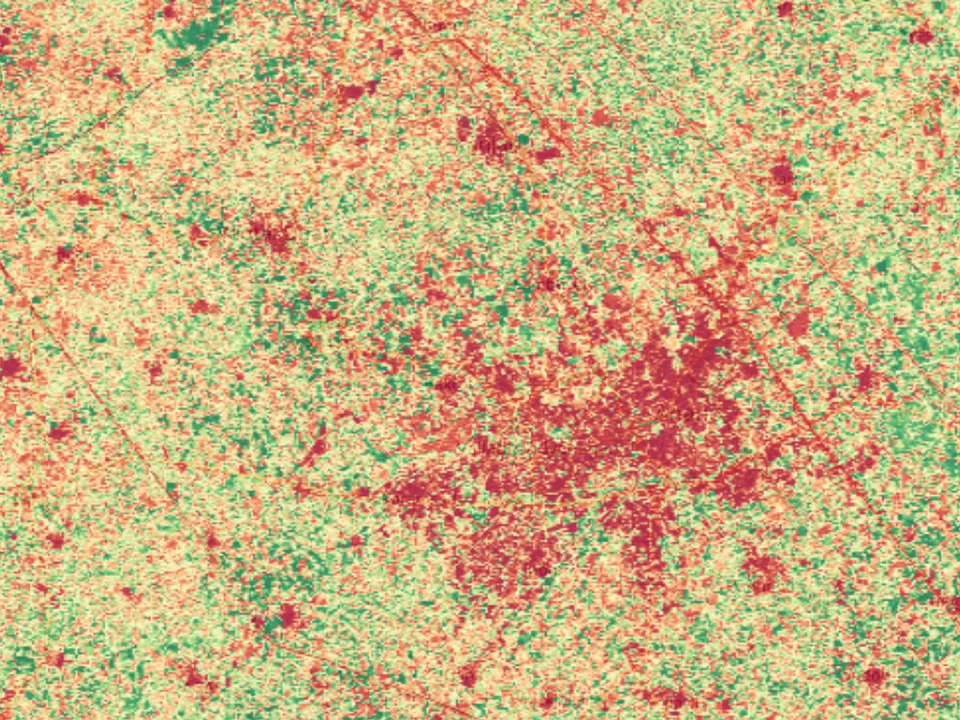
Vegetation index map of farmland around Anand: green for dense crops, yellow for moderate cover and red for bare ground and settlements. NDVI · Anand
01

Agriculture & land

Track crop vigour and land cover across a season, and flag fields that fall behind.

What you can check

  • Share of the area with dense, moderate or sparse vegetation on every clear date
  • Whether a field greened up on schedule, compared date by date
  • Seasonal change in a grid of up to four synchronised maps
  • NDVI
  • EVI
  • True Color
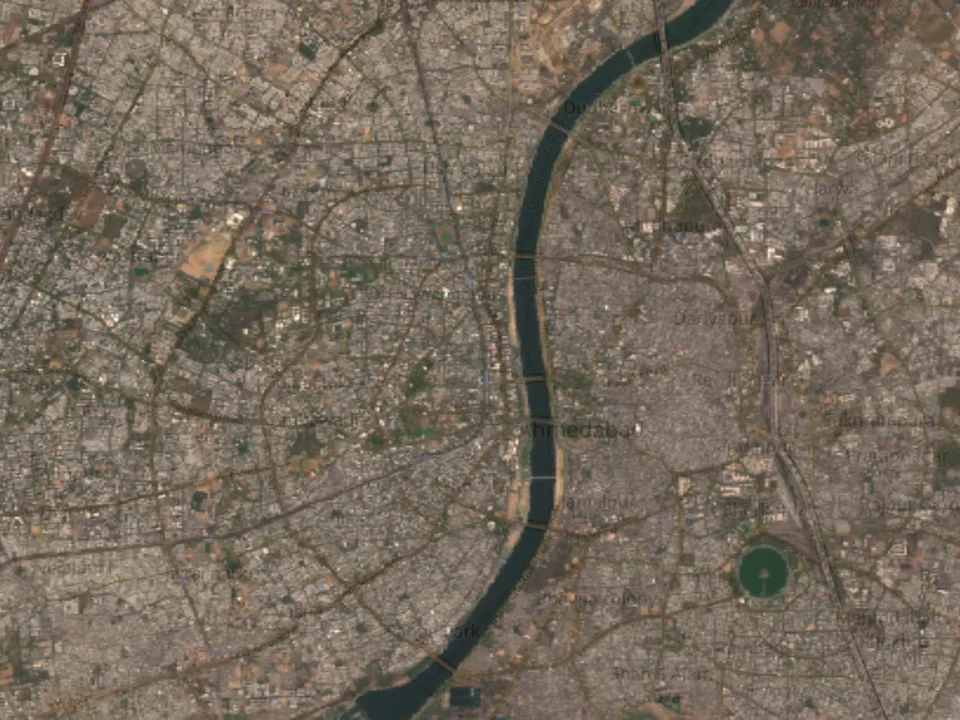
True-colour image of central Ahmedabad with the Sabarmati river running through the city. True Color · Ahmedabad
02

Urban & infrastructure

Monitor built-up expansion and site activity between two dates, with dated imagery as a record.

What you can check

  • Estimated built-up area in km², and how it changed between two dates
  • Construction progress on a site, using the swipe comparison
  • Radar evidence of new structures when cloud hides the optical view
  • NDBI
  • True Color
  • Radar
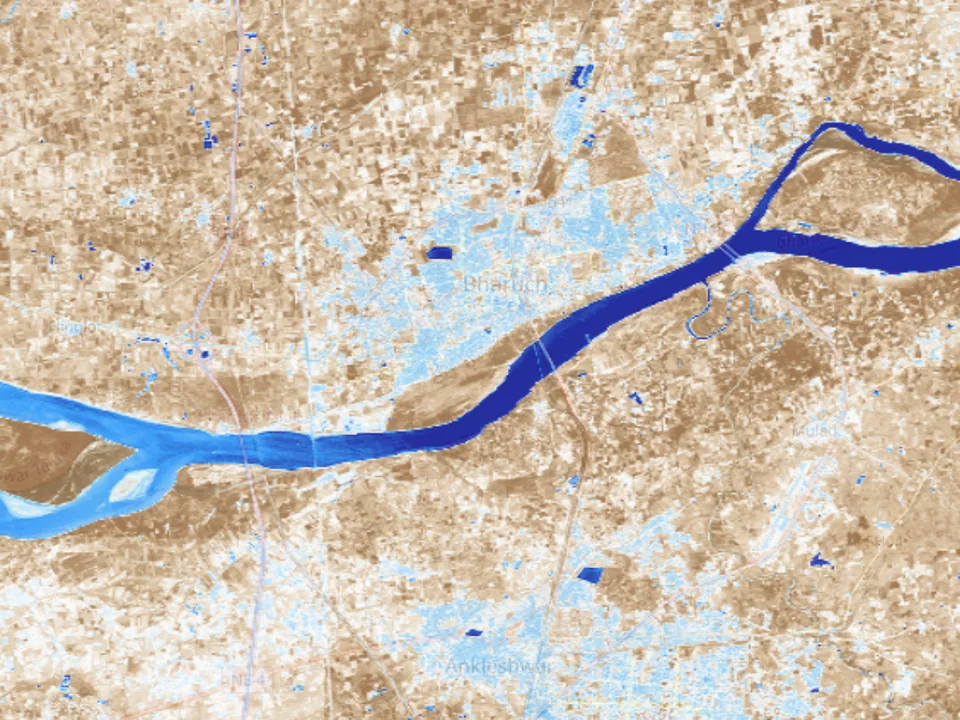
Water index map of the Narmada river near Bharuch: dark blue open water, light blue wet ground and brown dry land. NDWI · Bharuch
03

Water, flood & drought

Measure open-water area and wet ground, including under cloud cover using radar.

What you can check

  • Open-water area in km² for each capture, from optical or radar
  • Areas likely flooded after a storm, even through monsoon cloud
  • Surface temperature hot spots from thermal infrared
  • NDWI
  • Radar
  • Thermal
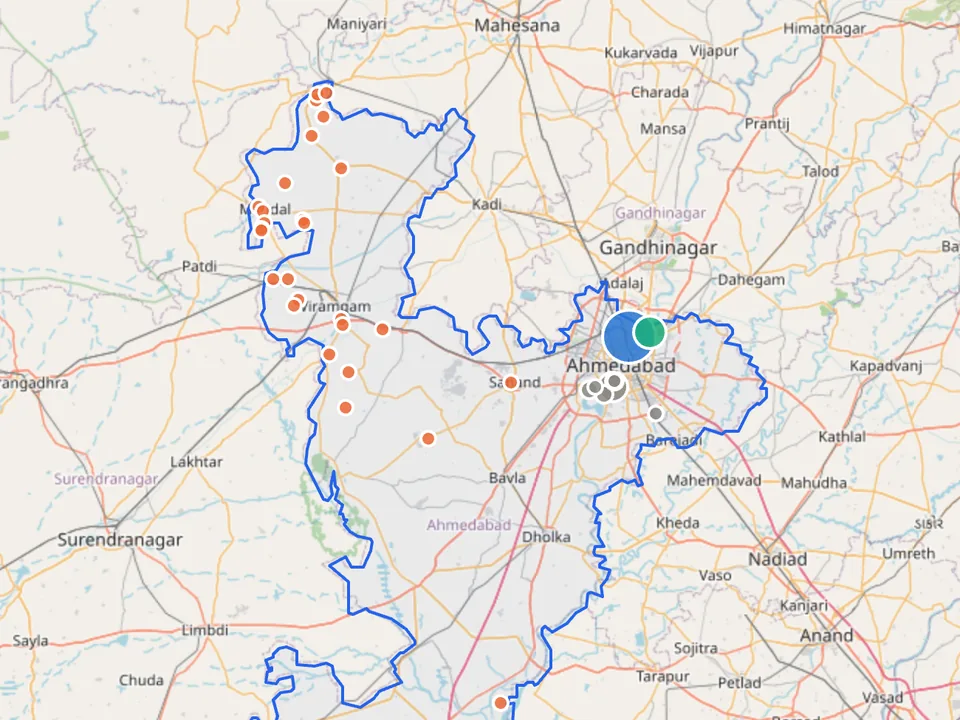
Ahmadabad District boundary on the map with emitting facilities marked as circles sized by emissions. Carbon · Ahmadabad
04

Air quality & ESG screening

Put a district's emissions, sectors and facilities next to measured gas trends for the same place.

What you can check

  • A district's yearly CO₂-equivalent emissions and the sectors behind them
  • The largest named facilities near a site or supplier
  • Whether NO₂, methane and CO over an area are rising or falling
  • Carbon
  • NO₂
  • CH₄
  • CO

Start with your own area

BluVerify opens straight to the map. Draw an area and your first report is a search away.