Data coverage

15 data products and a district emissions inventory

Every product BluVerify can search, what it measures, how it's delivered and the colour scale it's drawn with. This page is generated from the same catalogue the application uses, so it's always current.

Land imagery

Optical imagery

Up to 10 m, cloud and shadow masked

Questions it answersIs vegetation healthy? Where is open water, snow or new construction?

ProductWhat it showsOutputColour scale
True Color Visual photoCloud filter available PNG (image)History from March 2013 True colour
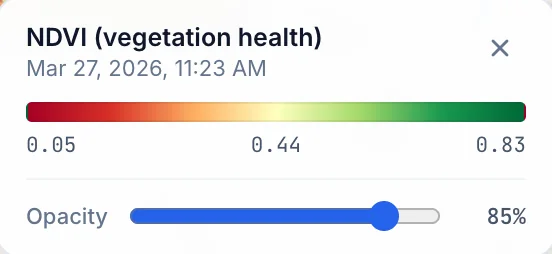
NDVI Vegetation healthCloud filter available GeoTIFF (data values)History from March 2013 Vegetation
NDWI Water contentCloud filter available GeoTIFF (data values)History from March 2013 Water
NDBI Built-up / urban areasCloud filter available GeoTIFF (data values)History from March 2013 Thermal
NDSI Snow coverCloud filter available GeoTIFF (data values)History from March 2013 Water
EVI Enhanced vegetation indexCloud filter available GeoTIFF (data values)History from March 2013 Vegetation

All-weather

Radar

Works through cloud, day and night

Questions it answersWhere is standing water or flooding? Where are strong reflectors such as buildings?

ProductWhat it showsOutputColour scale
Radar Backscatter VV/VH Works through clouds/night GeoTIFF (data values)History from October 2014 Grayscale

Wide area

Ocean & land

Wide-area colour and thermal

Questions it answersHow warm is the surface, and where are the coolest and hottest spots?

ProductWhat it showsOutputColour scale
OLCI True Color Ocean/land PNG (image)History from March 2013 True colour
SLSTR Brightness Temp S8/S9 Thermal infraredCloud filter available GeoTIFF (data values)History from March 2013 Thermal

Atmosphere

Air quality

Quality-filtered trace gases

Questions it answersWhat are gas levels over the area, and what typically causes them?

ProductWhat it showsOutputColour scale
NO₂ Nitrogen dioxide GeoTIFF (data values)History from April 2018 Thermal
CH₄ Methane GeoTIFF (data values)History from April 2018 Thermal
CO Carbon monoxide GeoTIFF (data values)History from April 2018 Thermal
O₃ Ozone GeoTIFF (data values)History from April 2018 Thermal
SO₂ Sulfur dioxide GeoTIFF (data values)History from April 2018 Thermal
AER_AI Aerosol index GeoTIFF (data values)History from April 2018 Thermal

Climate TRACE

Emissions inventory

By district, sector and facility, yearly

Questions it answersHow much does this district emit, from which sectors and which facilities?

10 report categories

Climate TRACE's ~90 emission sectors are grouped into plain-language categories, each expandable to its underlying sectors in the report.

Try the live district lookup
  • Power & heat
  • Homes & buildings
  • Road transport
  • Aviation
  • Rail & shipping
  • Industry
  • Fossil fuels & mining
  • Agriculture & livestock
  • Waste
  • Forestry & land use

Developers: the product catalogue is also available as JSON at /api/products.

Methodology

Transparent about what the data can and cannot show

Land imagery before 2017 comes from an older 30 m archive; BluVerify switches automatically for each date and labels every date with its source, so a search can run from a decade ago to this week. Coverage of the earliest years varies by region.

Optical measurements exclude clouds and cloud shadows, and dates where less than 5% of the area is visible are marked too cloudy to measure rather than guessed. Air-quality data is published a few days after each observation, so recent dates say not published yet instead of looking empty. Air-quality changes within sampling noise are reported as “about the same”.

Data sources

  • Copernicus (European Union)Optical, radar, thermal and atmospheric measurements
  • Climate TRACEGreenhouse-gas emissions by district, sector and facility
  • OpenStreetMapBase map and place names

Start with your own area

BluVerify opens straight to the map. Draw an area and your first report is a search away.