 BluVerify Intelligence
 Analysis on your computers
Assessments, reports and the assistant run on the licensed computer. Your saved areas and results stay there.

BluVerify Intelligence
An AI system that runs on your organisation's own computers. It assesses eighteen kinds of environmental risk and change for any area, projects what is likely next, watches your sites every day and explains every finding in a report built for scrutiny.
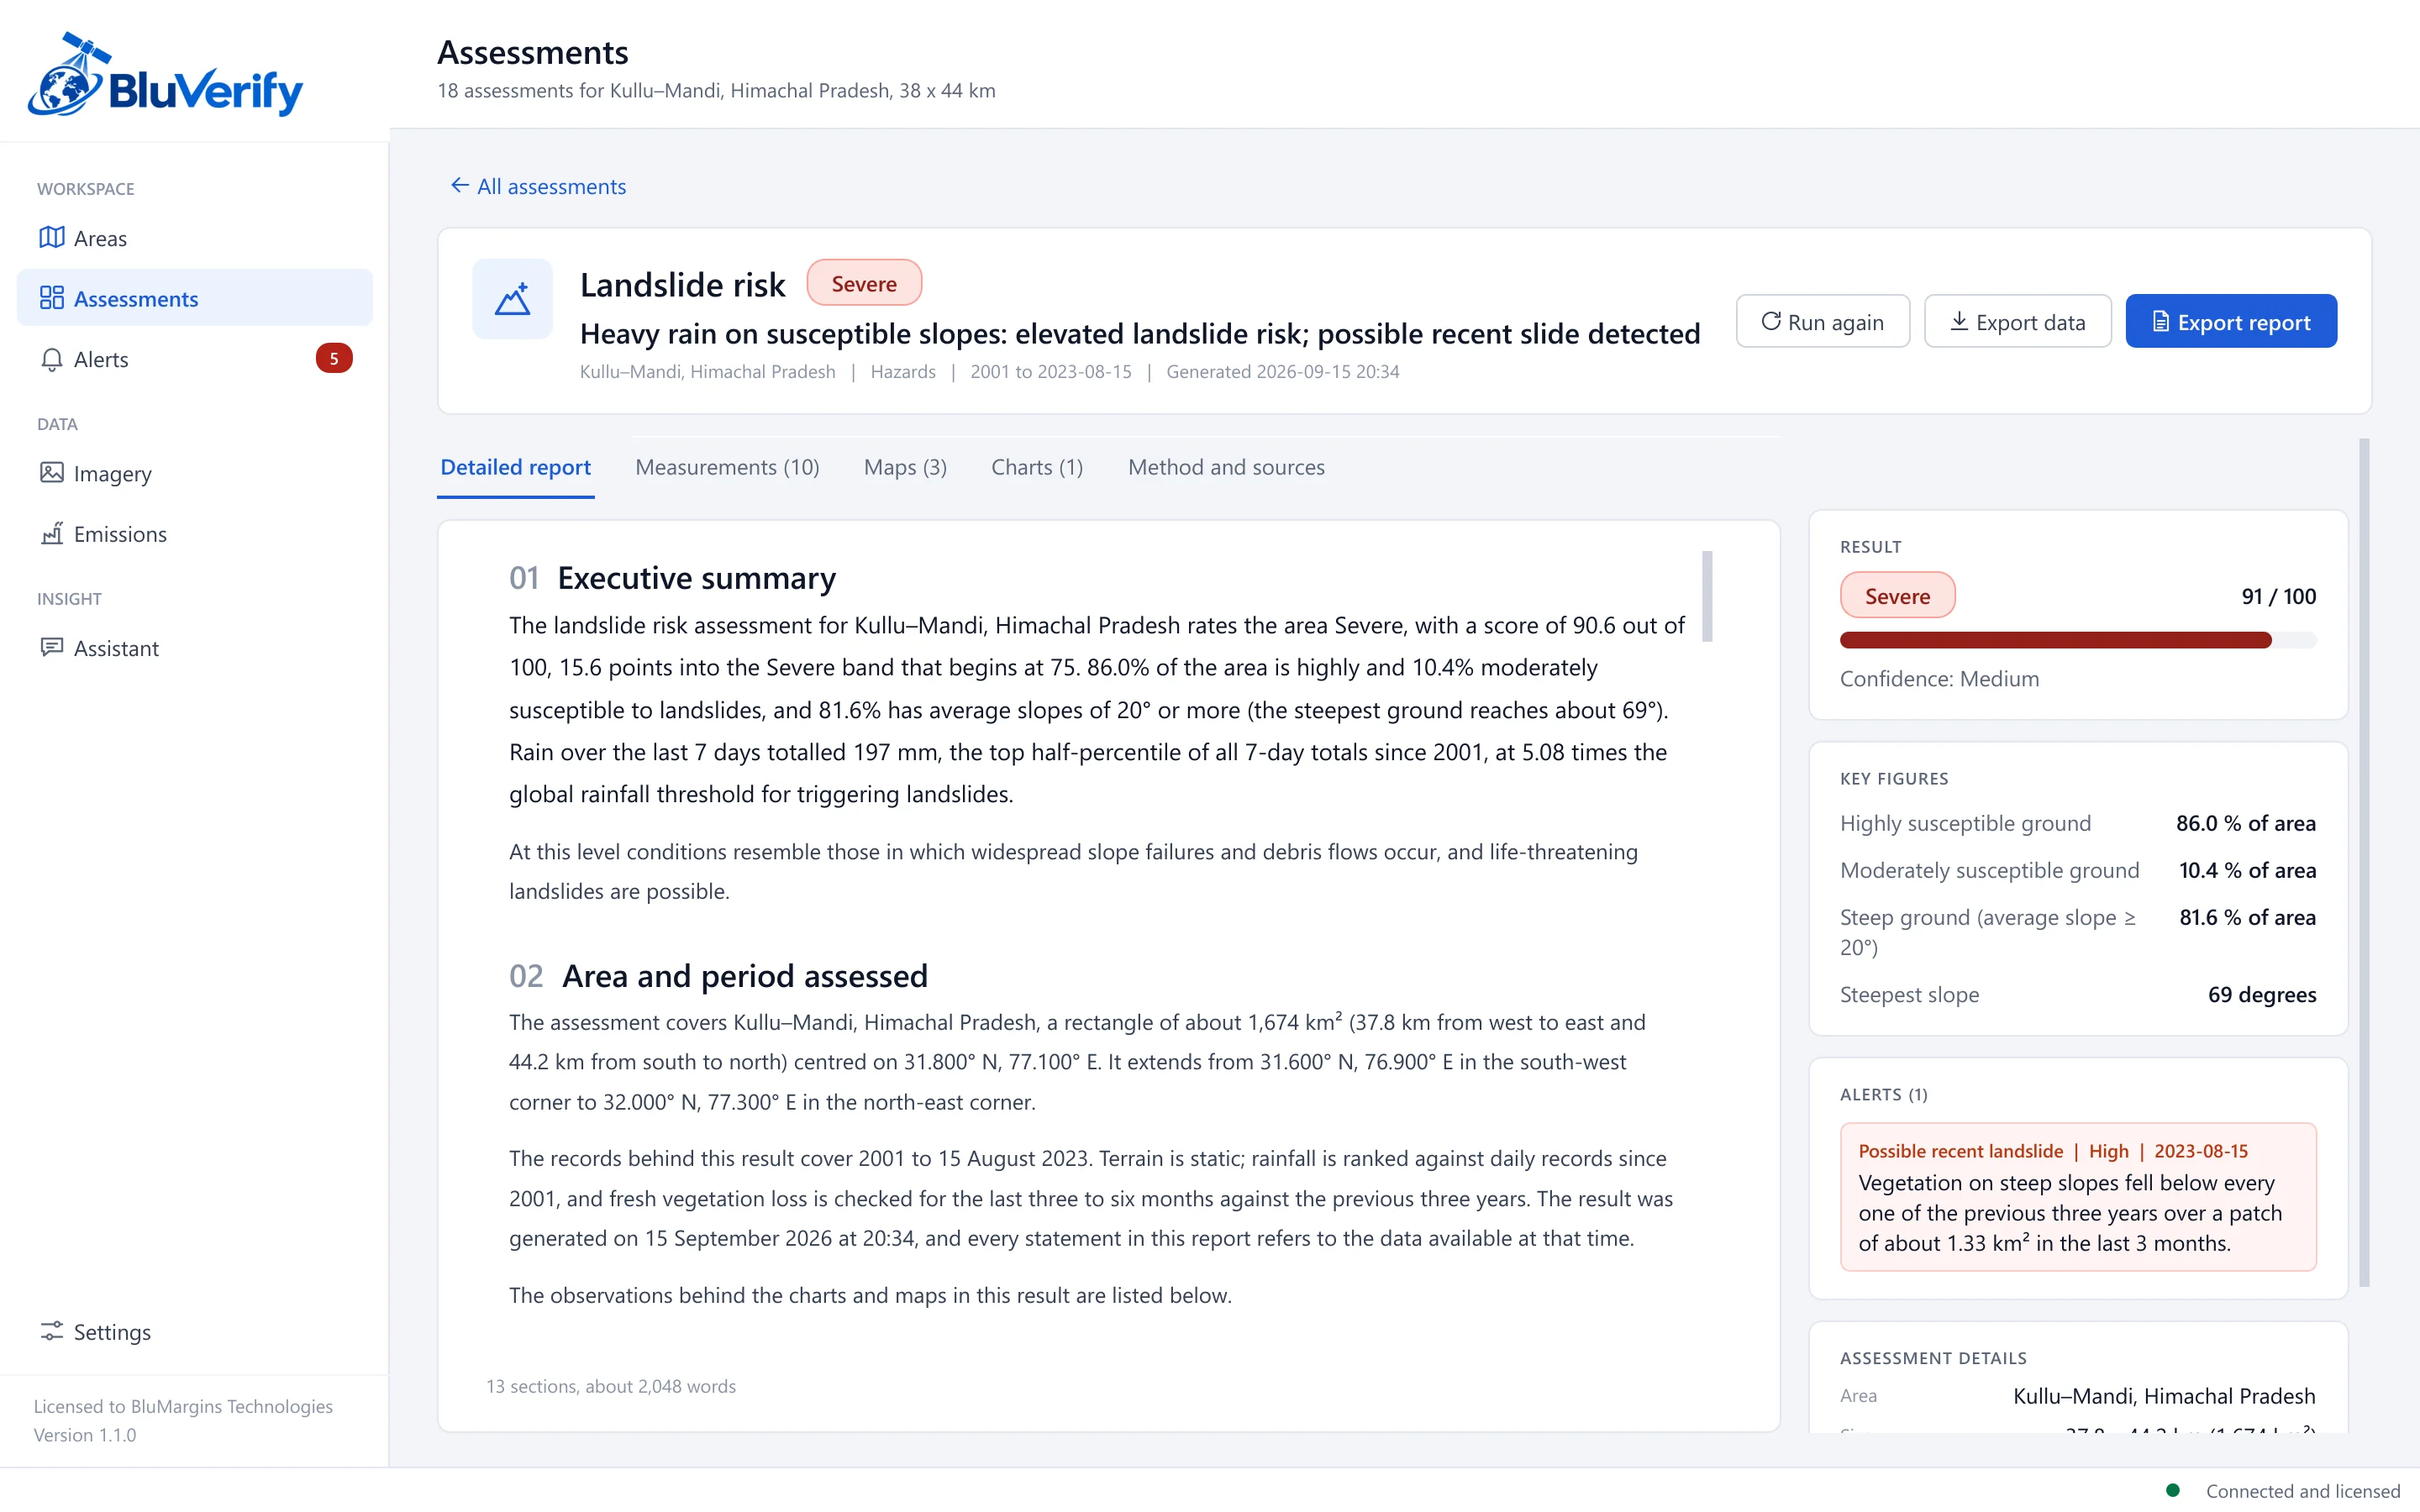
A detailed landslide risk report for Kullu and Mandi, Himachal Pradesh, as of 15 August 2023.
Capabilities
Draw an area once. Intelligence gathers its history, analyses it with specialised methods and keeps watching it, so your team spends its time on the response rather than the data.
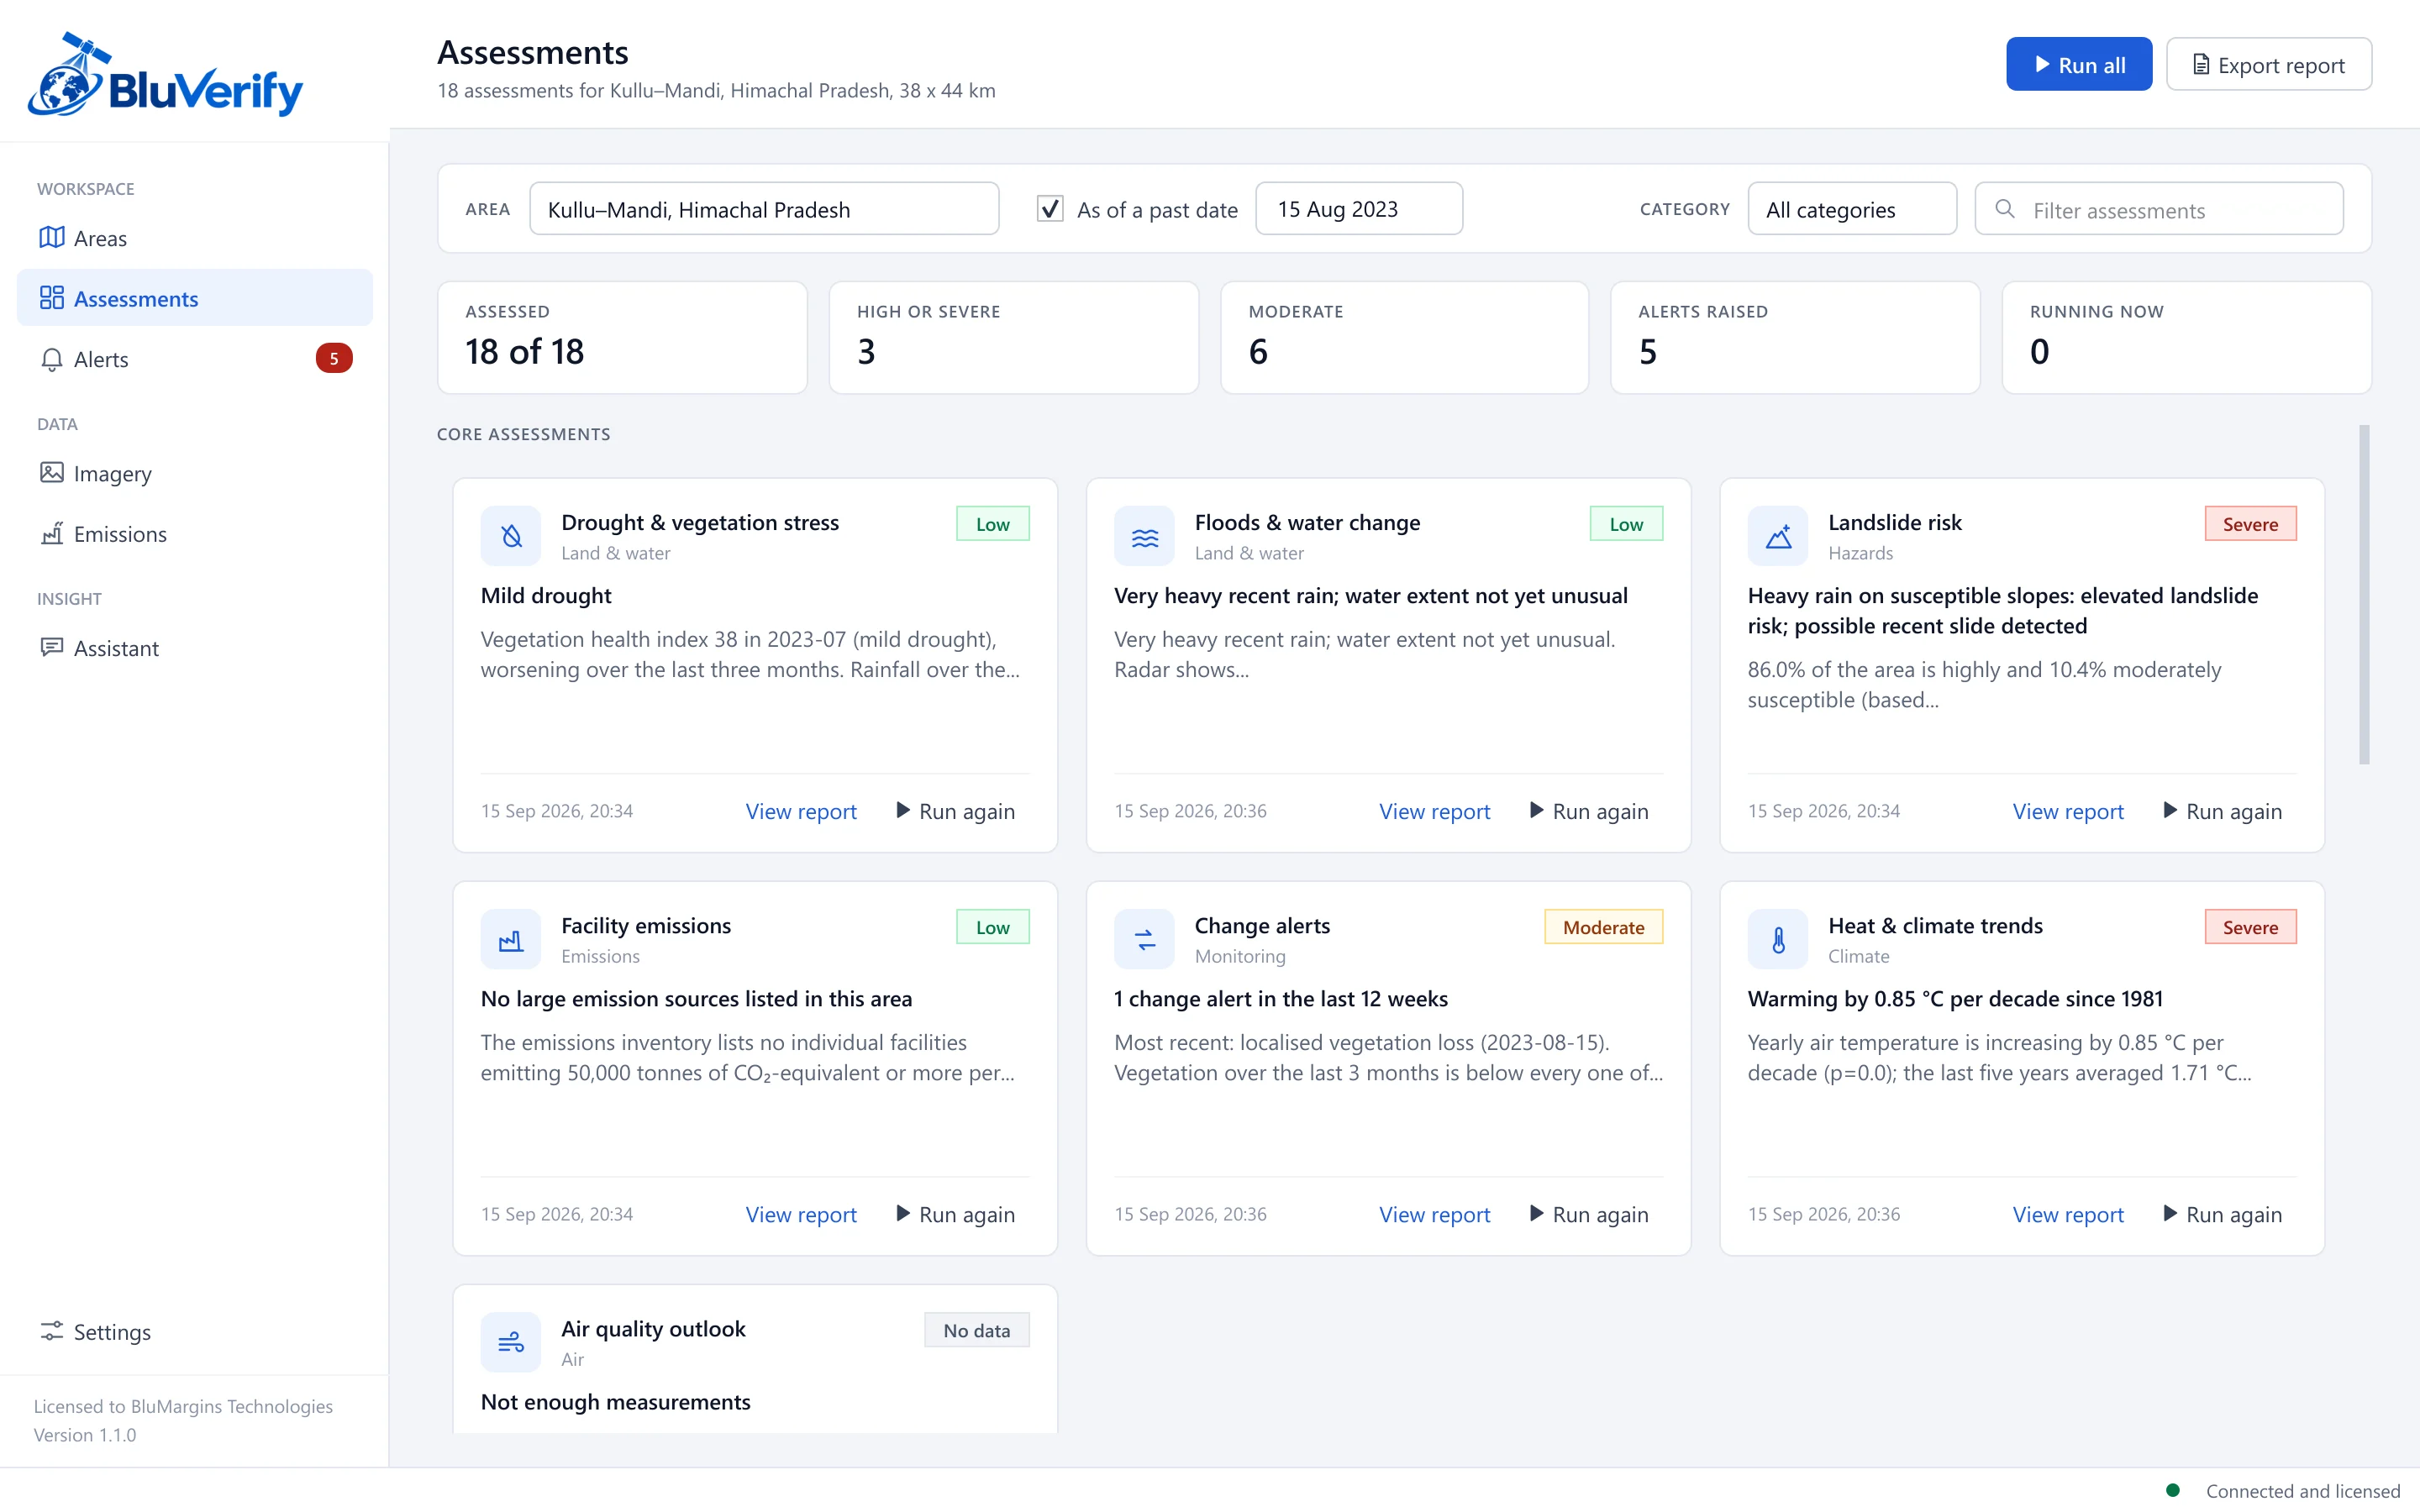
Run one assessment or all eighteen. Each card shows the level, the finding and a short summary, with progress while it runs and the option to stop it. Reproduce any date in the past to see what the evidence showed at the time.
Each result is written up as a structured report: an executive summary, current conditions, comparison with the typical range, trend, outlook, spatial pattern, drivers, implications, recommended actions, confidence and limitations.
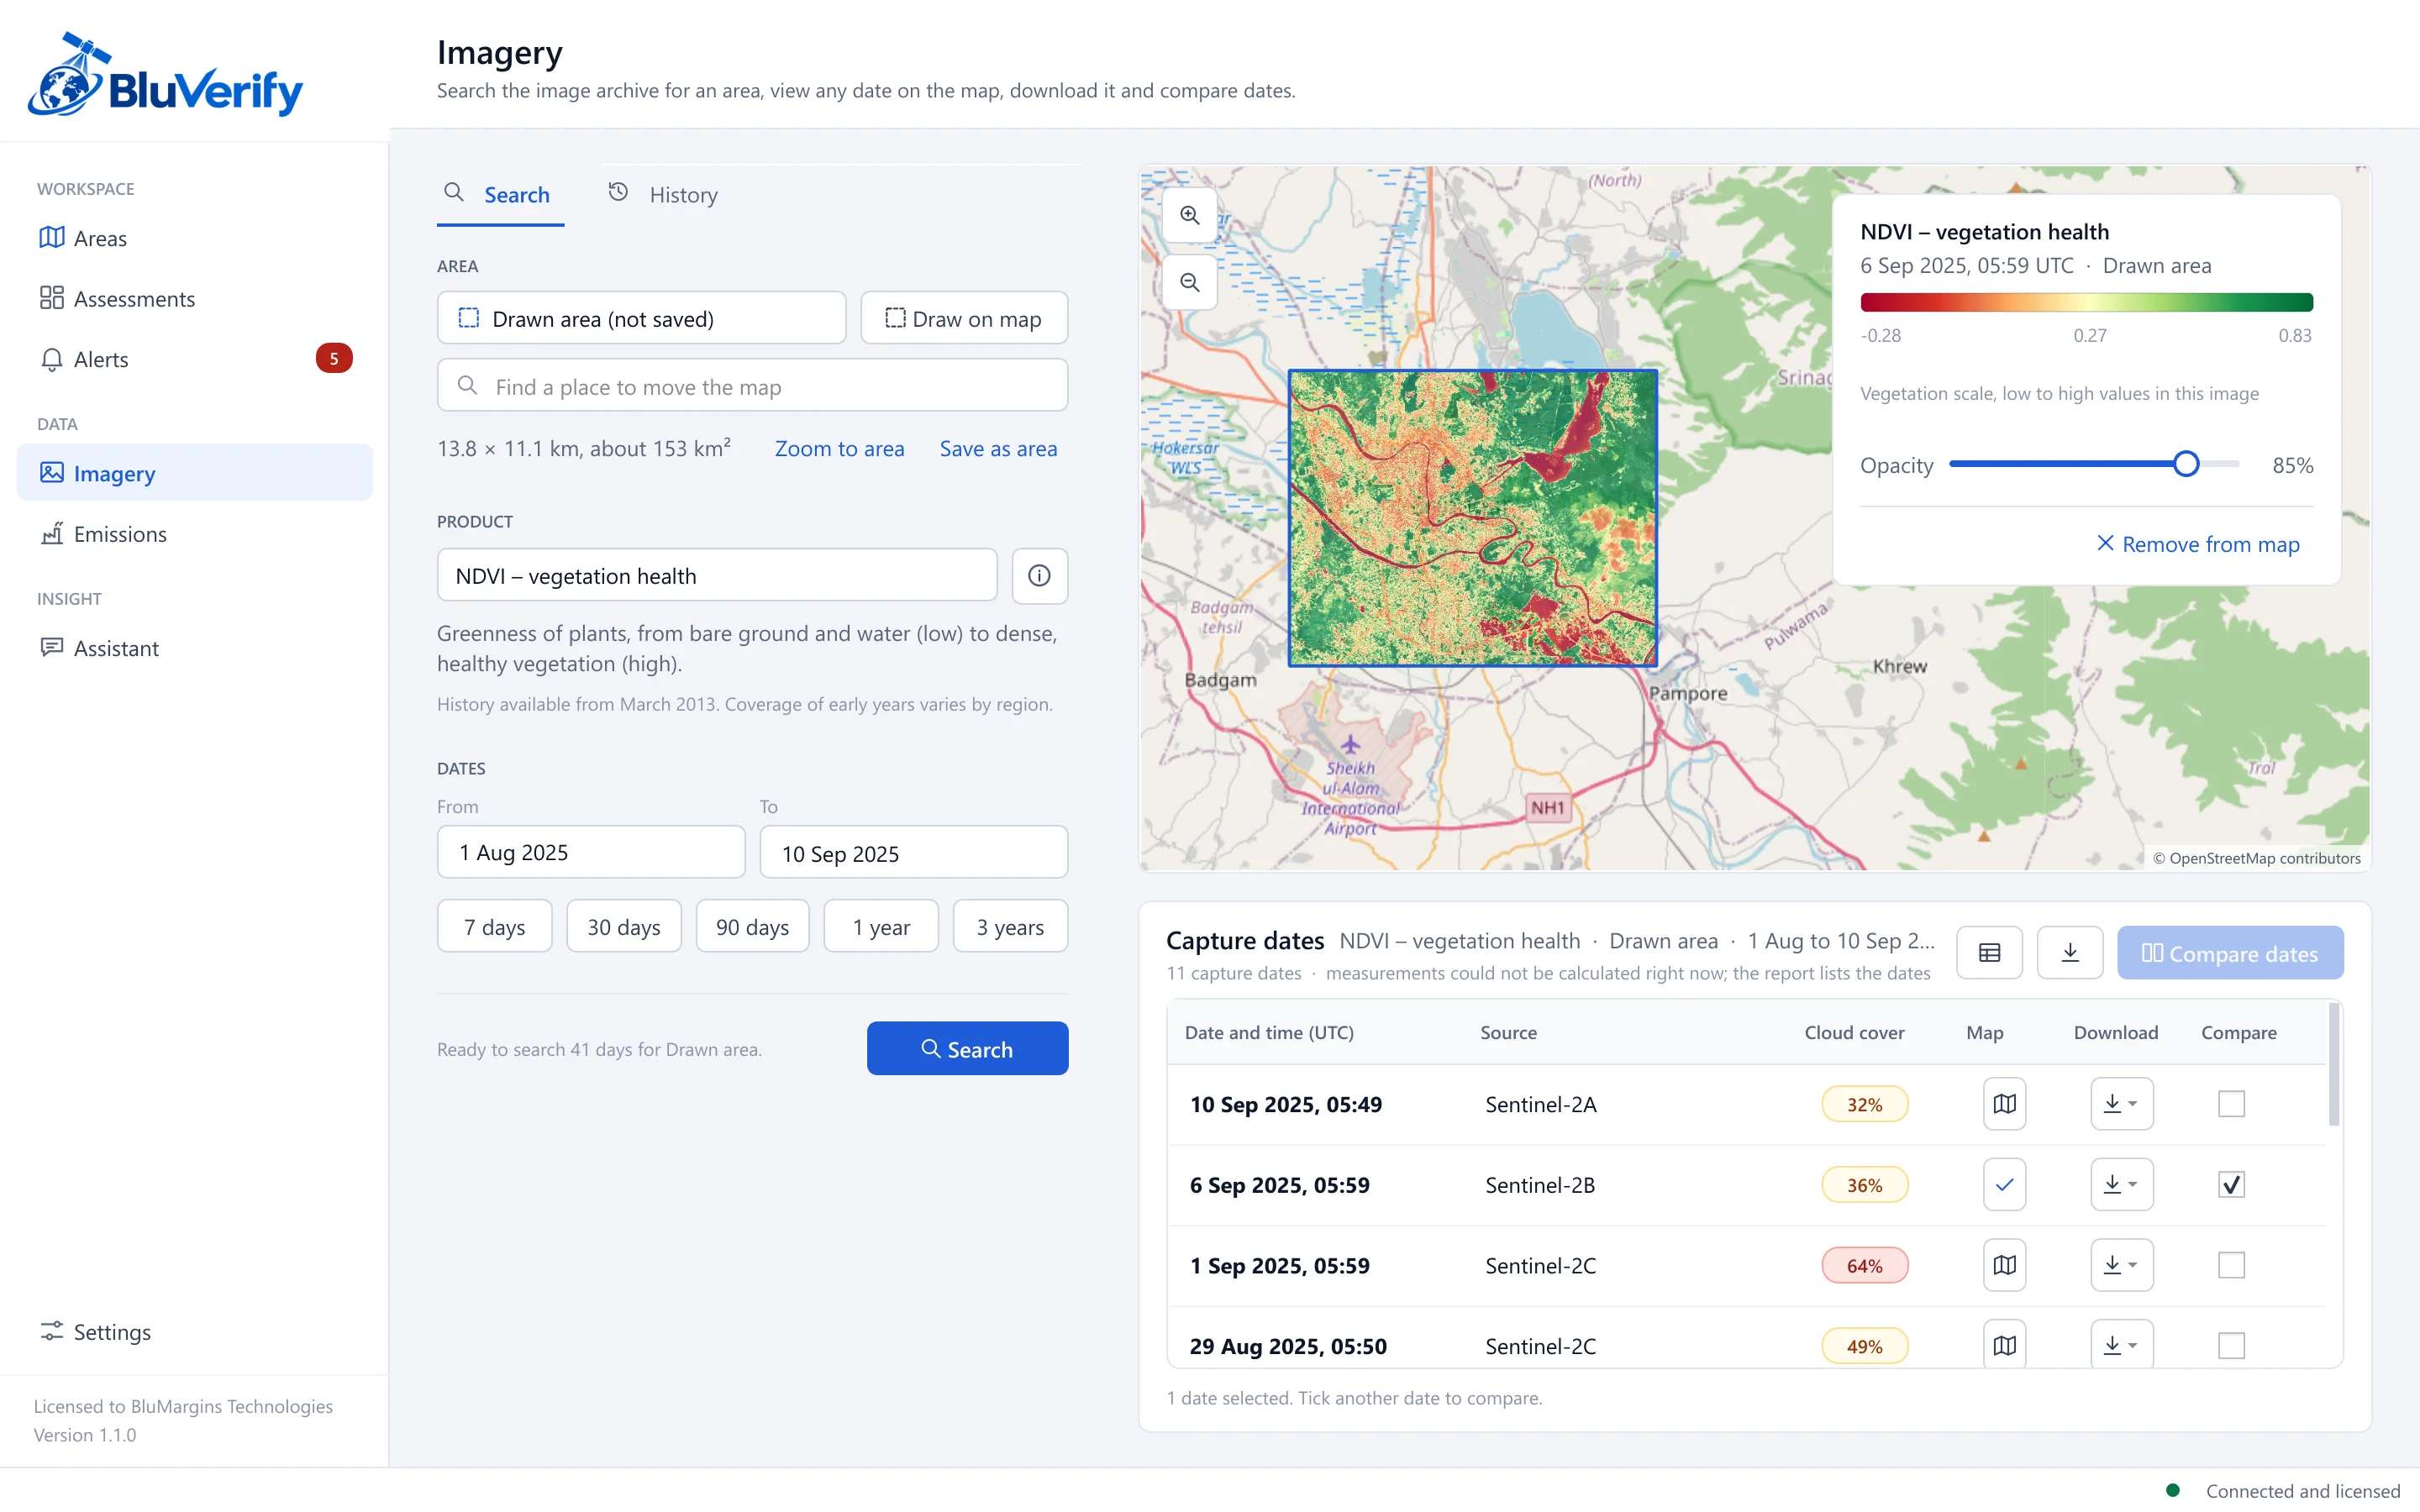
Search fifteen imagery products for any dates since 2013, view a capture on the map with its legend, download it, and compare dates side by side, with a swipe or in a grid. Past searches stay available and can be compared as one table.
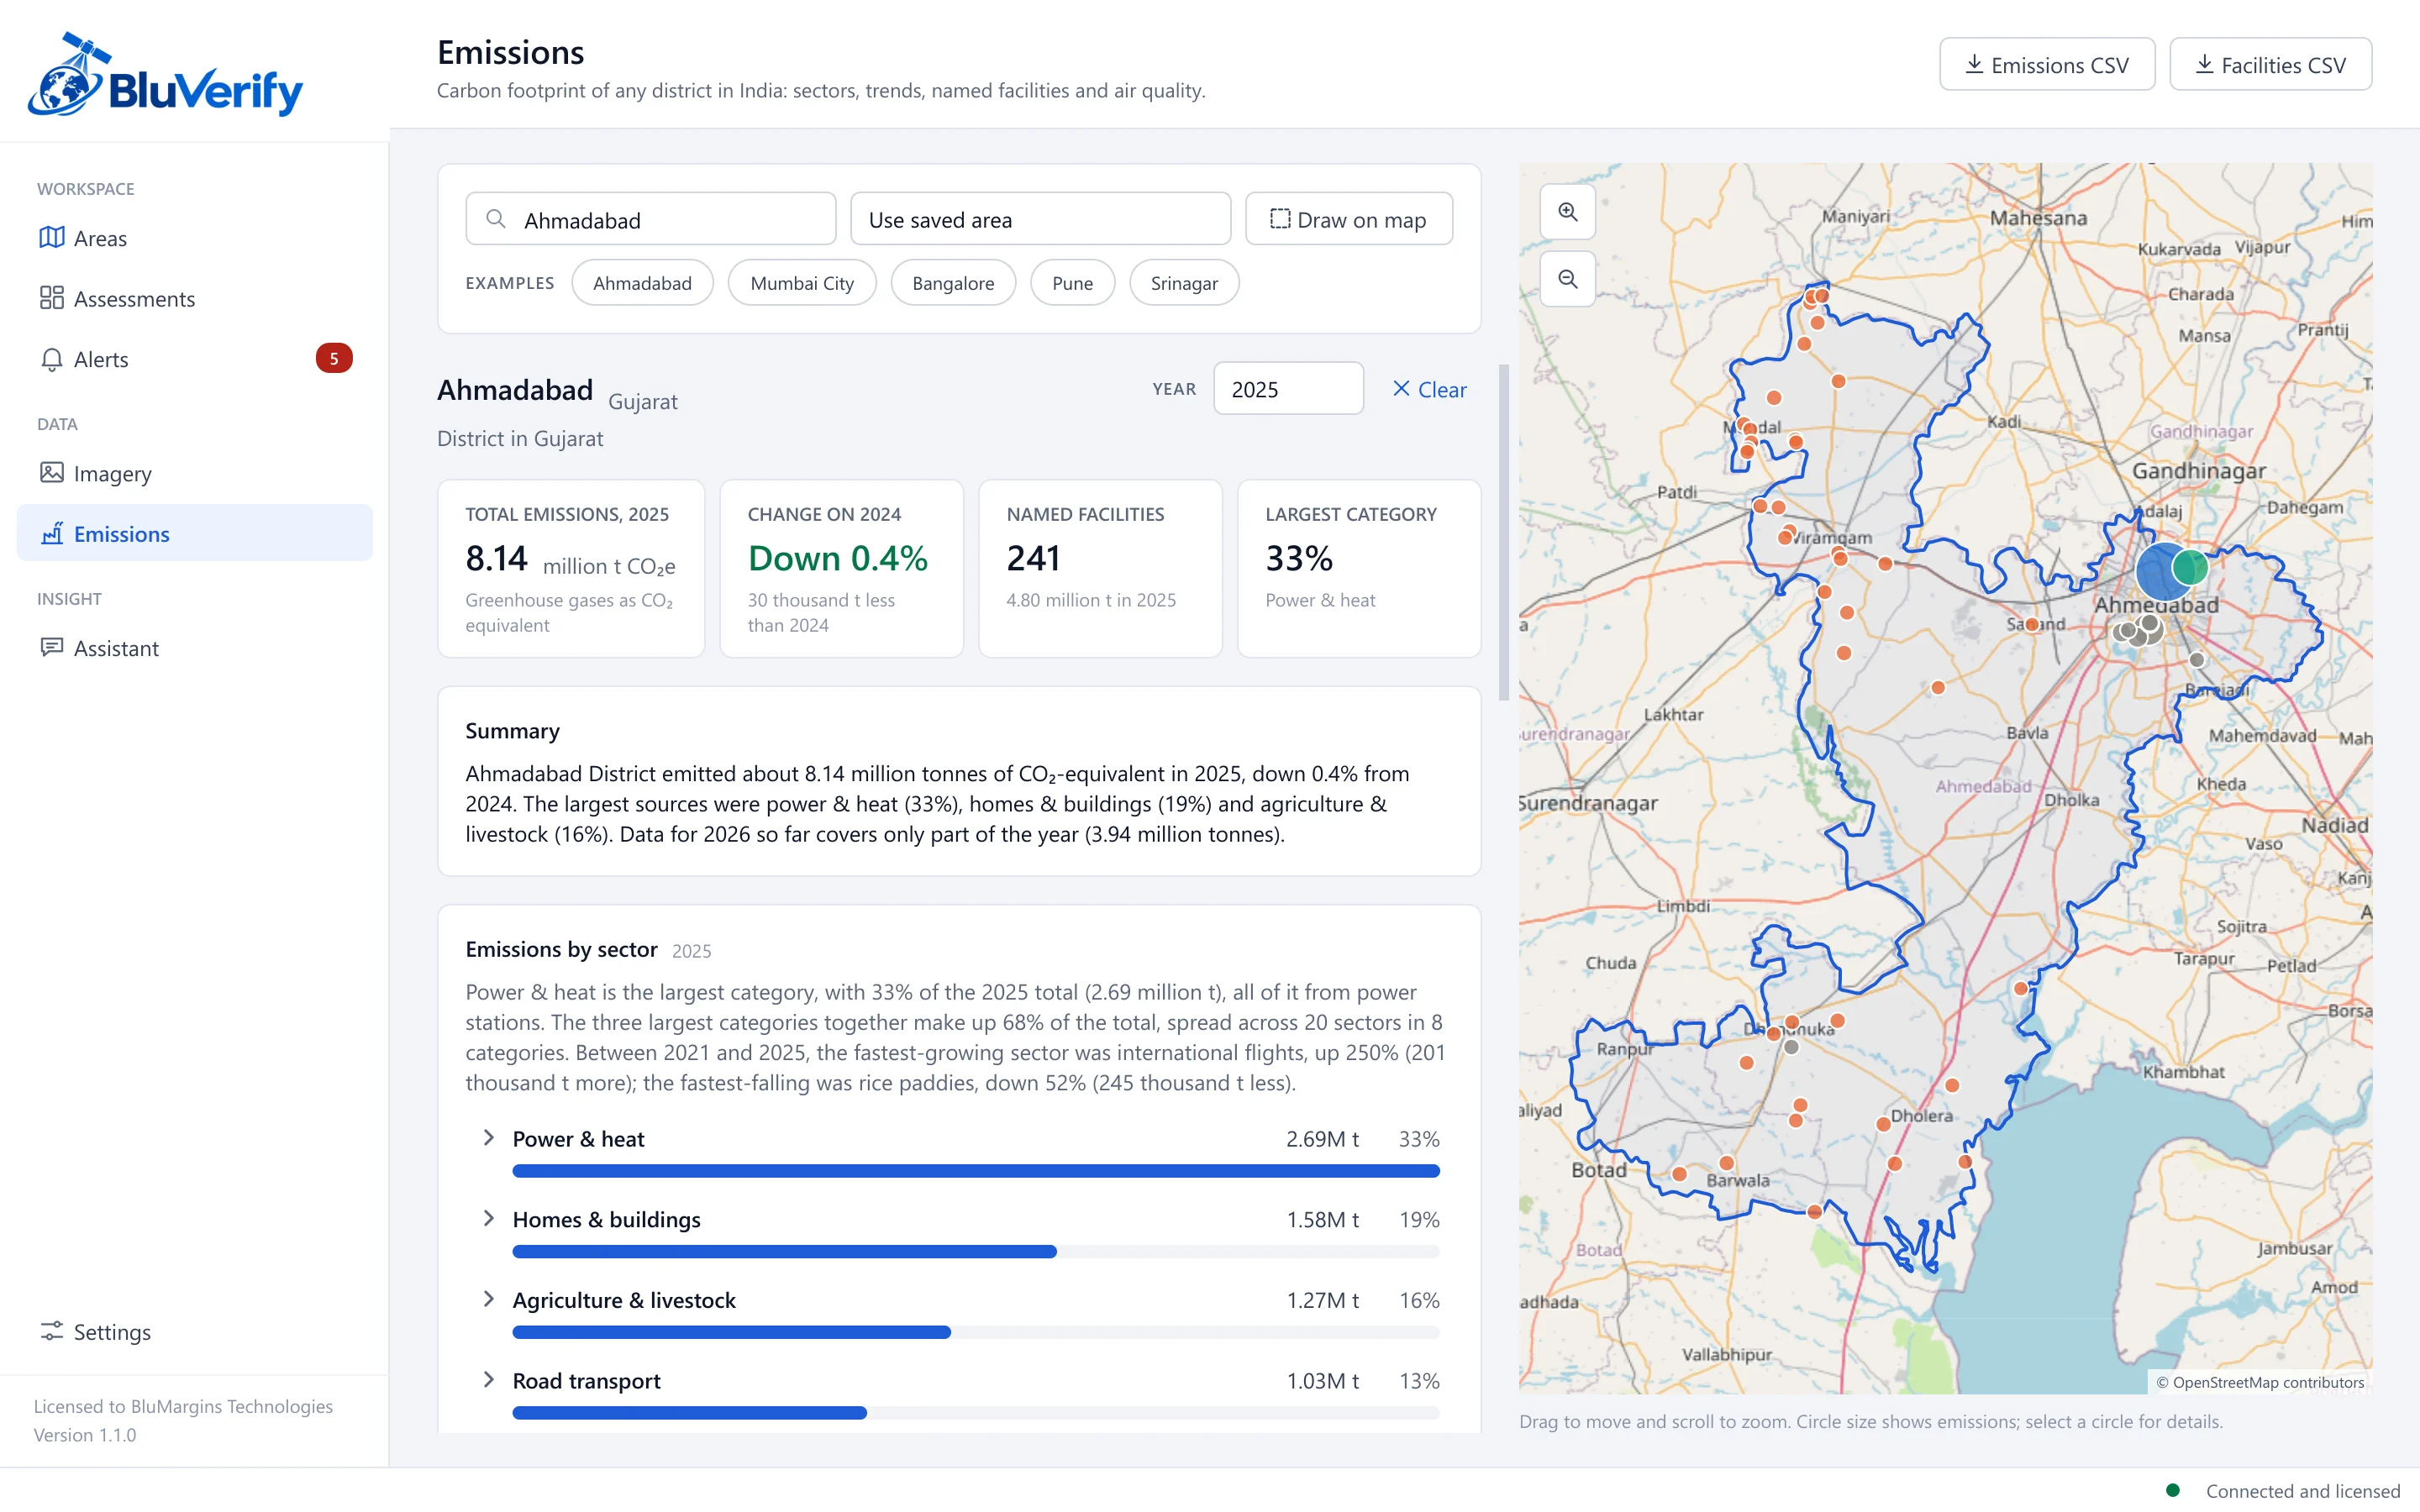
Open any district's carbon footprint by sector and year, see named facilities on the map, and compare the air over your area with its district for nitrogen dioxide, methane and carbon monoxide.
Assessments
Every assessment uses established scientific methods suited to its question, applied to your area's own history rather than a generic national average.
| Assessment | Category | What it tells you |
|---|---|---|
| Drought and vegetation stress | Land and water | Vegetation health, rainfall deficit and heat stress, with a three-month outlook. |
| Floods and water change | Land and water | Unusual water extent confirmed by radar and optical evidence, with detailed water maps. |
| Landslide risk | Hazards | Terrain susceptibility combined with rainfall triggers, and detection of fresh landslide scars. |
| Glacial lakes and outburst floods | Hazards | Lake growth, steep ground around lakes and melt triggers that raise outburst concern. |
| Wildfire danger and burn scars | Hazards | Fire weather, vegetation dryness, fire detections and mapped burned land. |
| Heat and climate trends | Climate | Warming rates, hot-day counts and a twelve-month temperature outlook. |
| Snow and glacier change | Climate | Long-term change in seasonal snow cover and perennial snow. |
| Air quality outlook | Air | Nitrogen dioxide, carbon monoxide and aerosol levels against the season, with a seven-day outlook. |
| Crop residue burning | Air | Fire activity on farmland in the burning season compared with previous years. |
| Facility emissions | Emissions | Activity at large emitting sites and divergence from reported emissions. |
| Methane hotspots | Emissions | Persistent methane excess over the area compared with its surroundings. |
| Restoration and offset verification | Emissions | Vegetation gains inside a project area against its surroundings since the project began. |
| Change alerts | Monitoring | Vegetation loss, new construction and water change outside the normal seasonal range. |
| Forest loss and mining | Monitoring | Clearing below every earlier year and bare ground expanding next to new water. |
| Urban and wetland encroachment | Monitoring | Built-up growth and loss of vegetation or wetland against five years earlier. |
| Crop season outlook | Agriculture | This season's crop condition against earlier seasons, with its likely outcome. |
| Soil erosion and land degradation | Land and water | Estimated soil loss from rainfall, slope and vegetation cover. |
| Coastline change | Land and water | Land lost to or gained from the sea over five and eight years. |
Designed for sensitive work
Intelligence is built for public agencies and enterprises that must know where their information goes and who can use their tools.
Assessments, reports and the assistant run on the licensed computer. Your saved areas and results stay there.
Each licence is locked to the computer it is activated on. Copies of the software or its files do not run elsewhere.
Every result states its method, its sources, the period it covers and how confident it is, so findings hold up under review.
Saved areas and results open without a connection, and any assessment can be reproduced for a past date.
Deployment
Questions
Any area on land that you draw, from a single site to a district. Measured histories are available worldwide; district emissions reports and our validation work currently focus on India.
No. A licence is locked to the computer it is first activated on and cannot be transferred. Additional computers each need their own licence.
Outlooks are tested against past seasons before release and must perform at least as well as a seasonal baseline. Each outlook shows a 10 to 90 percent range, so uncertainty is always visible.
No. Intelligence is a screening and monitoring system. It shows where conditions are unusual and why, so that field teams and authorities can focus their attention.
Submit the request below. We arrange a walkthrough on your own areas, agree the number of licences and help your team install and activate the system.
Request access
Tell us about your organisation and the places you need to watch. A specialist will contact you to arrange a walkthrough on your own areas and prepare licences for your team.
A member of our team reads every request and replies by email within two working days.
We run the assessments on locations that matter to you, so you can judge the results on familiar ground.
Each licence is issued for one computer. We help your team install, activate and start monitoring.
Prefer email? Write to mail@bluverify.com
Thank you. A specialist will contact you by email within two working days.
Reference