Carbon footprint
District emissions, sector by sector, with the air to match
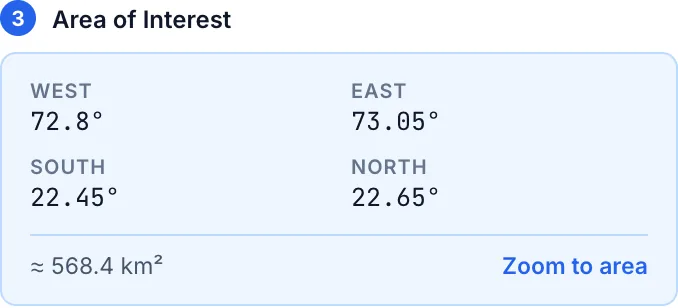
Search a district by name or draw an area on the map. BluVerify finds the district by real boundary overlap and builds its greenhouse-gas footprint from Climate TRACE, then checks it against measured air-quality trends.
Live data
Try it on any district
Current figures from Climate TRACE, fetched as you search. Change the year to see how the footprint has moved.
Loading live emissions data from Climate TRACE…
The full report
Everything in the application
The application's report goes further than the live lookup, with the district map, named sources and an air-quality cross-check.
- Yearly CO₂-equivalent totals and year-on-year change
- Breakdown into 10 plain-language sectors
- Named facilities, such as power stations, landfills and airports, on the map
- Measured NO₂, methane and CO: the last 12 months against the 12 before
- Emissions and facilities CSVs for your own analysis
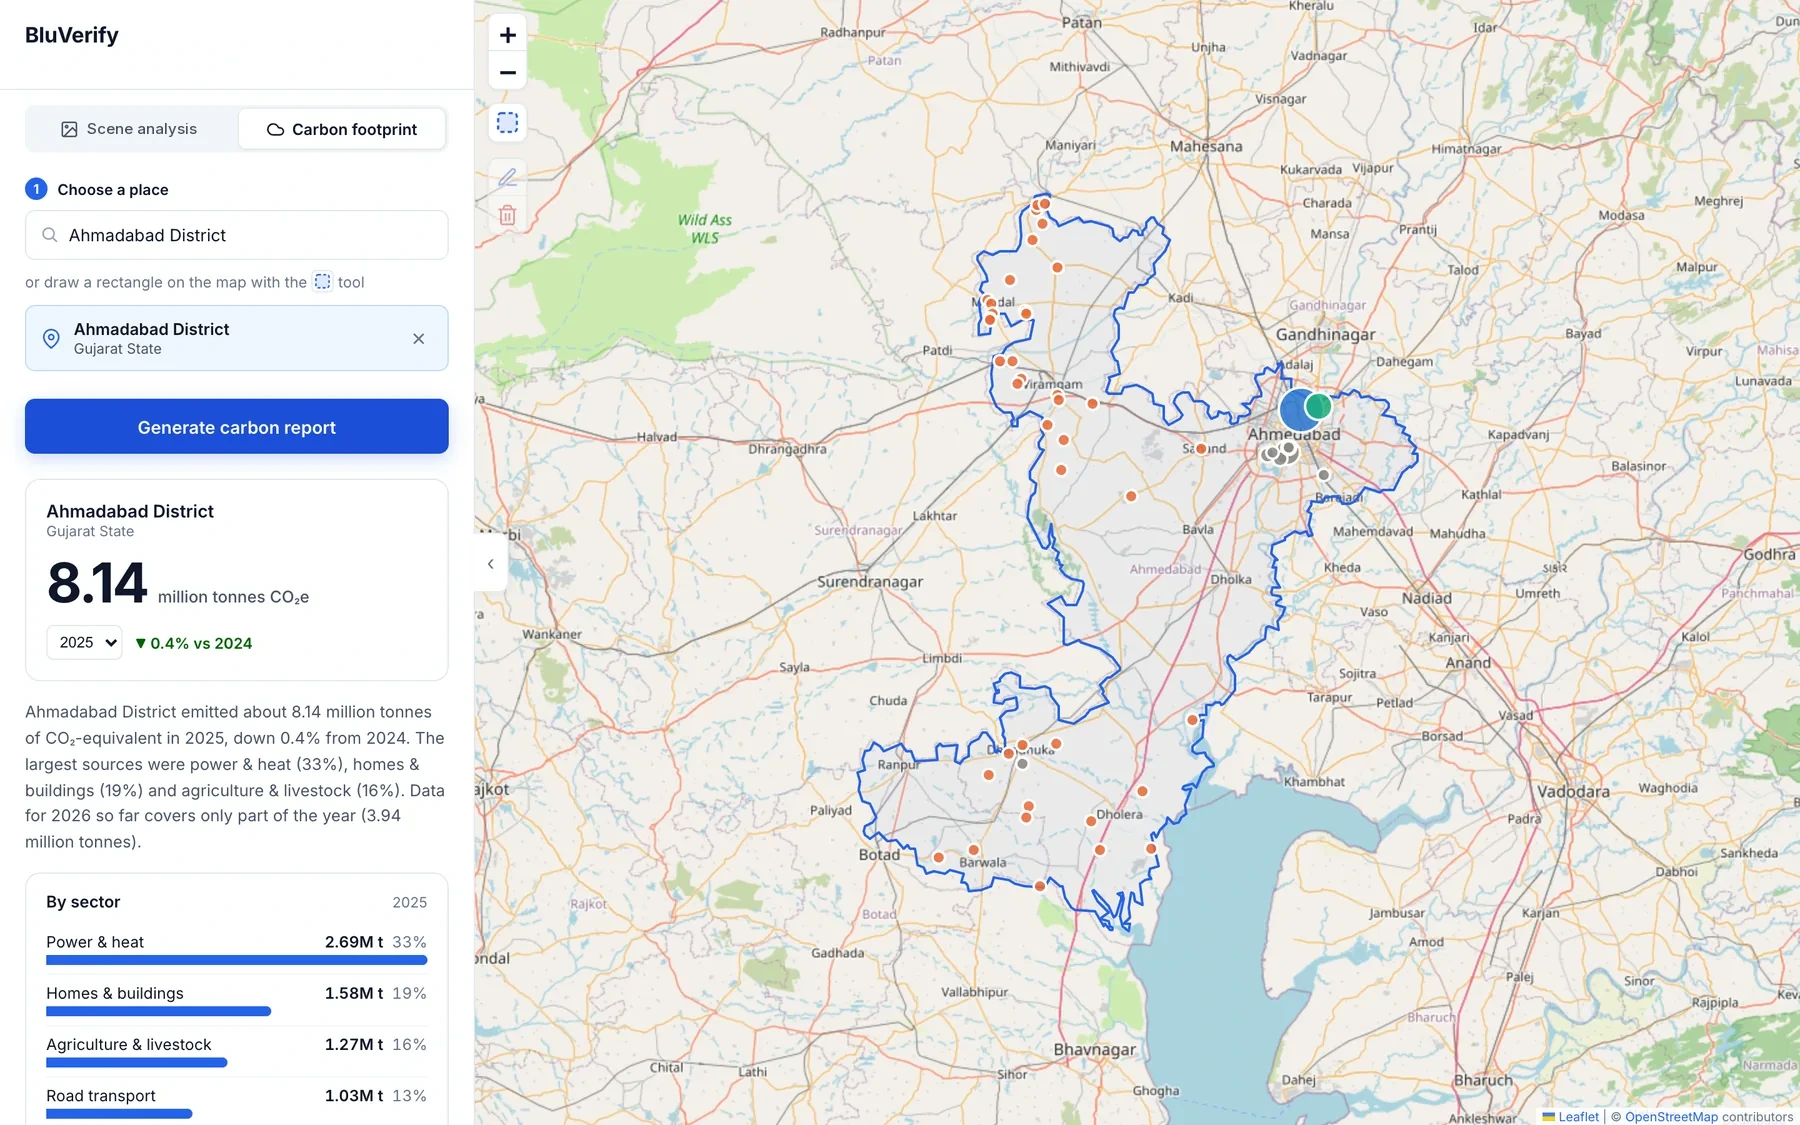
Inside a district report
Ahmadabad District, Gujarat · generated in BluVerify
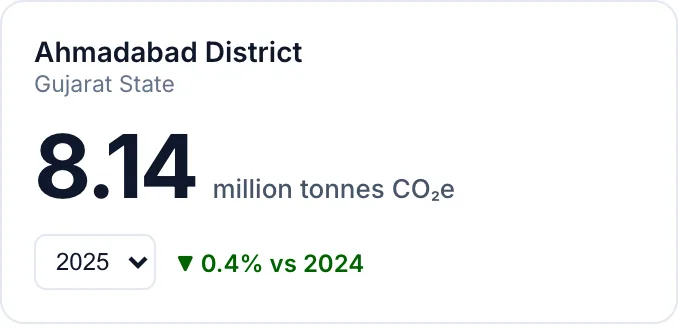
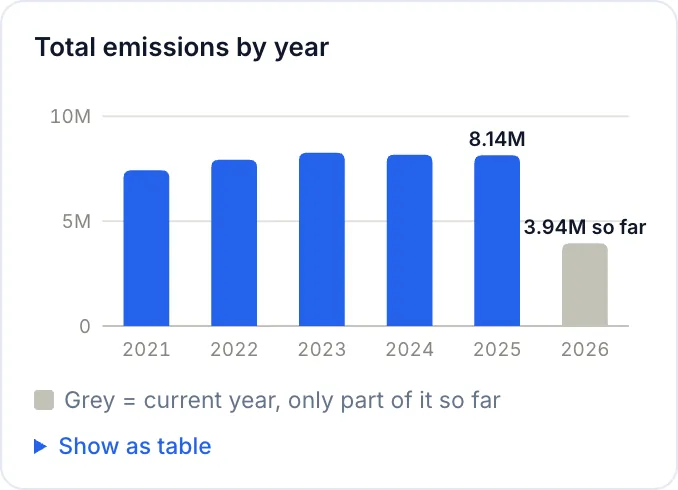
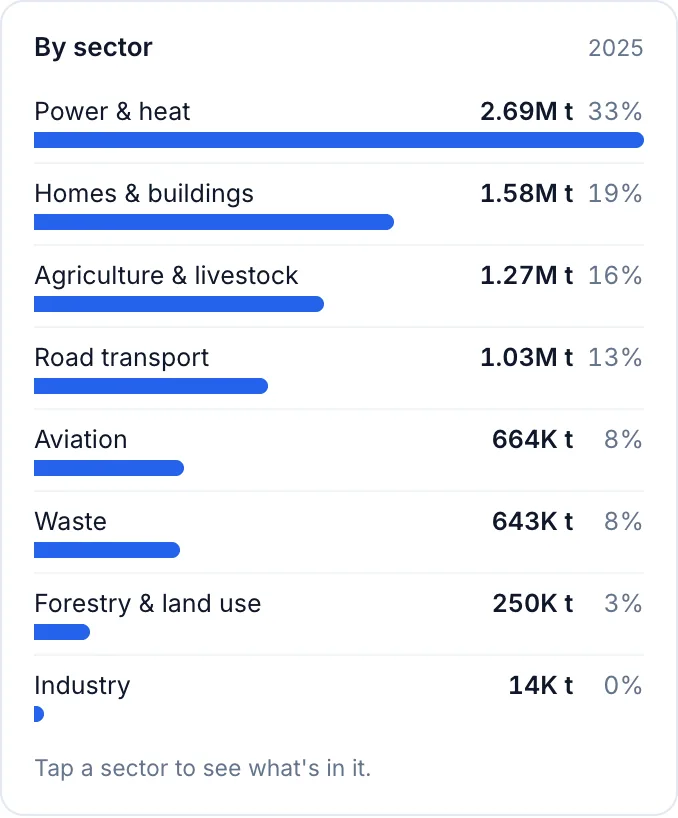
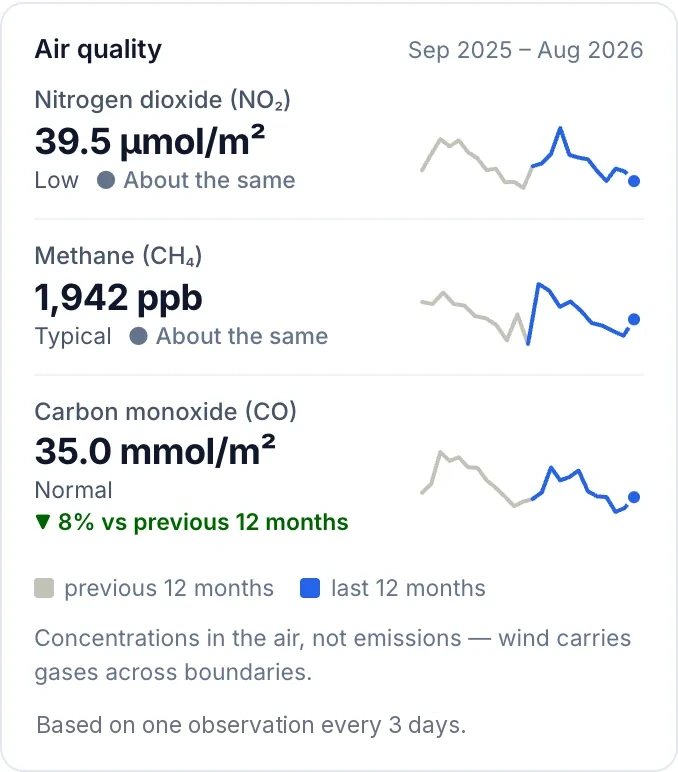
Emissions data: Climate TRACE. Figures are estimates for screening, not a certified footprint.
Scope
What the footprint includes, and what it leaves out
Reports cover emissions only. The net carbon balance of forests, grassland and wetlands is excluded: it swings between uptake and release and would distort year-on-year comparisons. Direct land-use emissions, such as forest clearing and fires, wetland fires and soil carbon loss from farmland, are kept.
A drawn rectangle is matched to districts by real boundary overlap, not a loose bounding-box search. Air indicators are measured concentrations, not emissions. Wind carries gases across boundaries, so they complement the inventory rather than replace it.
Start with your own area
BluVerify opens straight to the map. Draw an area and your first report is a search away.